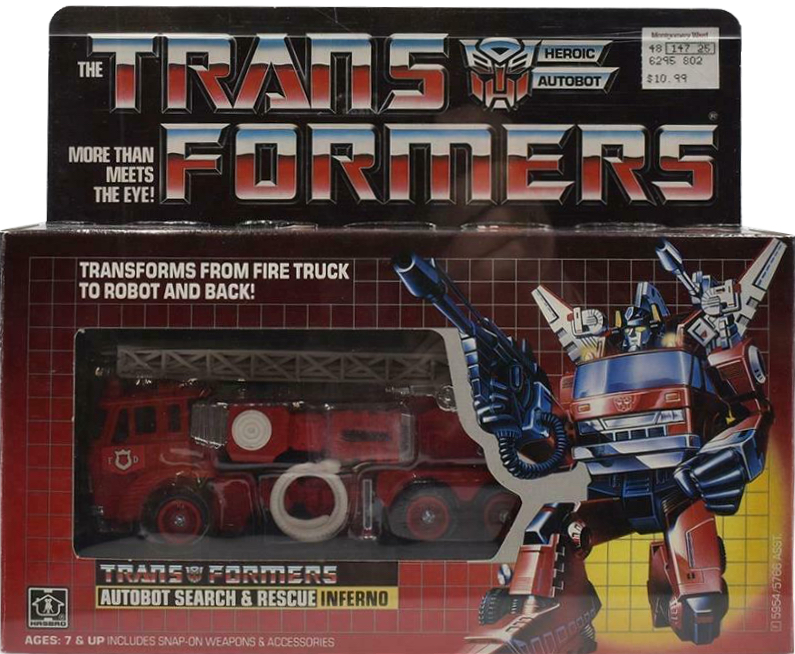
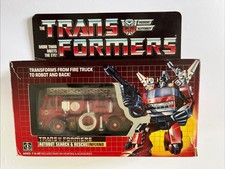
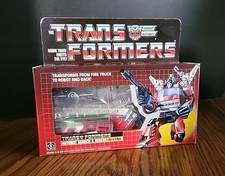
Transformers G1 Inferno
Function: Search & Rescue
Motto: Where there's smoke, there's me
The hotter things get, the better I like it! ... not only fires, but battle too. Often distracted from performing his job to engage in combat. Can do anything Earth fire trucks can in vehicular mode. Great strength... ceramic-plated armored skin can take up to 8000°C. Extinguisher rifle shoots flame-suppressing foam and an energy damping beam to counter other beams. Forearms shoot missiles. Doesn't follow orders well, not very mobile as robot.
Alternate mode: Mitsubishi Fuso Fire Engine-
Wave: 2
Year: 1985
Retail: $9.95 Series: G1 Group: Autobots - View in: Price Guide | Visual Guide | Checklist
-
- Share:


- Help us improve this page

Where to Buy:
| Retailer | Price | Diff | Lowest Found |
|---|---|---|---|
| Avg: $446.25 | +$436.30 (+4385%) | $80.00 | |
| Avg: $189.47 | +$179.52 (+1804%) | $91.00 | |
| AF411 Marketplace | 0 items for Sale. | ||
| When you click on links on this site and make a purchase, this can result in this site earning a commission. Affiliate programs and affiliations include, but are not limited to, the eBay Partner Network and Amazon Associates program: Affiliate Disclosure | |||
The average price based upon the last 4 sold auctions is: $446.25
[High: $1,200.00/Low: $80.00]. The average Buy It Now price is $189.47 based upon 6 filtered active auctions out of 14 which includes AFA graded auctions.
[Not enough auctions to build price history graph]
Active auctions are not calculated into the price history graph. Rows that are gray are excluded from BIN calculations 


Items sold that determine avg selling price in Price History Graph


This Inferno toy was added on August 2022 and originally released in 1985 with a retail price of $9.95. This action figure is part of the Transformers genre within the G1 series and included in Wave 2. With an average selling price of $446.25, this toy is highly collectible as it's selling for 44x over its retail price and is trending up. Quite a few (75) of these toys are in user collections so it does seem to be somewhat popular. AFA auctions are considered in determining the value of this item, potentially leading to a greater variance in the price range.
Tip: Click on a thumbnail image for a larger size.